
When people talk about India’s economic growth, the focus often stays at the national level. Big GDP numbers sound impressive, but they don’t tell the full story. To truly understand where India’s wealth comes from, we need to zoom in and look at the richest states in India by GDP based on state-wise GSDP of India.
At the state level, economic strength is not evenly distributed. A handful of states generate a disproportionately large share of India’s total output, while others contribute more modestly. This uneven distribution explains why state-wise analysis is so important—it highlights opportunity, imbalance, and future growth potential all at once.
In this article, we’ll break down how state-wise GSDP of India works, which states dominate the economic map with real numbers, and what factors make some states richer than others.
Understanding State-wise GSDP of India and Why It Matters
GSDP, or Gross State Domestic Product, is simply GDP calculated at the state level. It measures the total value of goods and services produced within a state over a specific period. When we compare GSDP figures across states, we get a clear picture of India’s internal economic structure.
The importance of state-wise GSDP of India lies in the fact that India is not one single economy—it’s a collection of regional economies. Each state has different industries, workforce strengths, infrastructure quality, and investment capacity. National GDP growth is ultimately shaped by how these individual state economies perform.
Another key point is that GSDP rankings are not permanent. States can move up or down depending on policy decisions, infrastructure expansion, industrial growth, or urban development. That’s why GSDP should be viewed as an indicator of momentum, not just size.
State-wise GSDP of India: Top Economic Contributors with Numbers
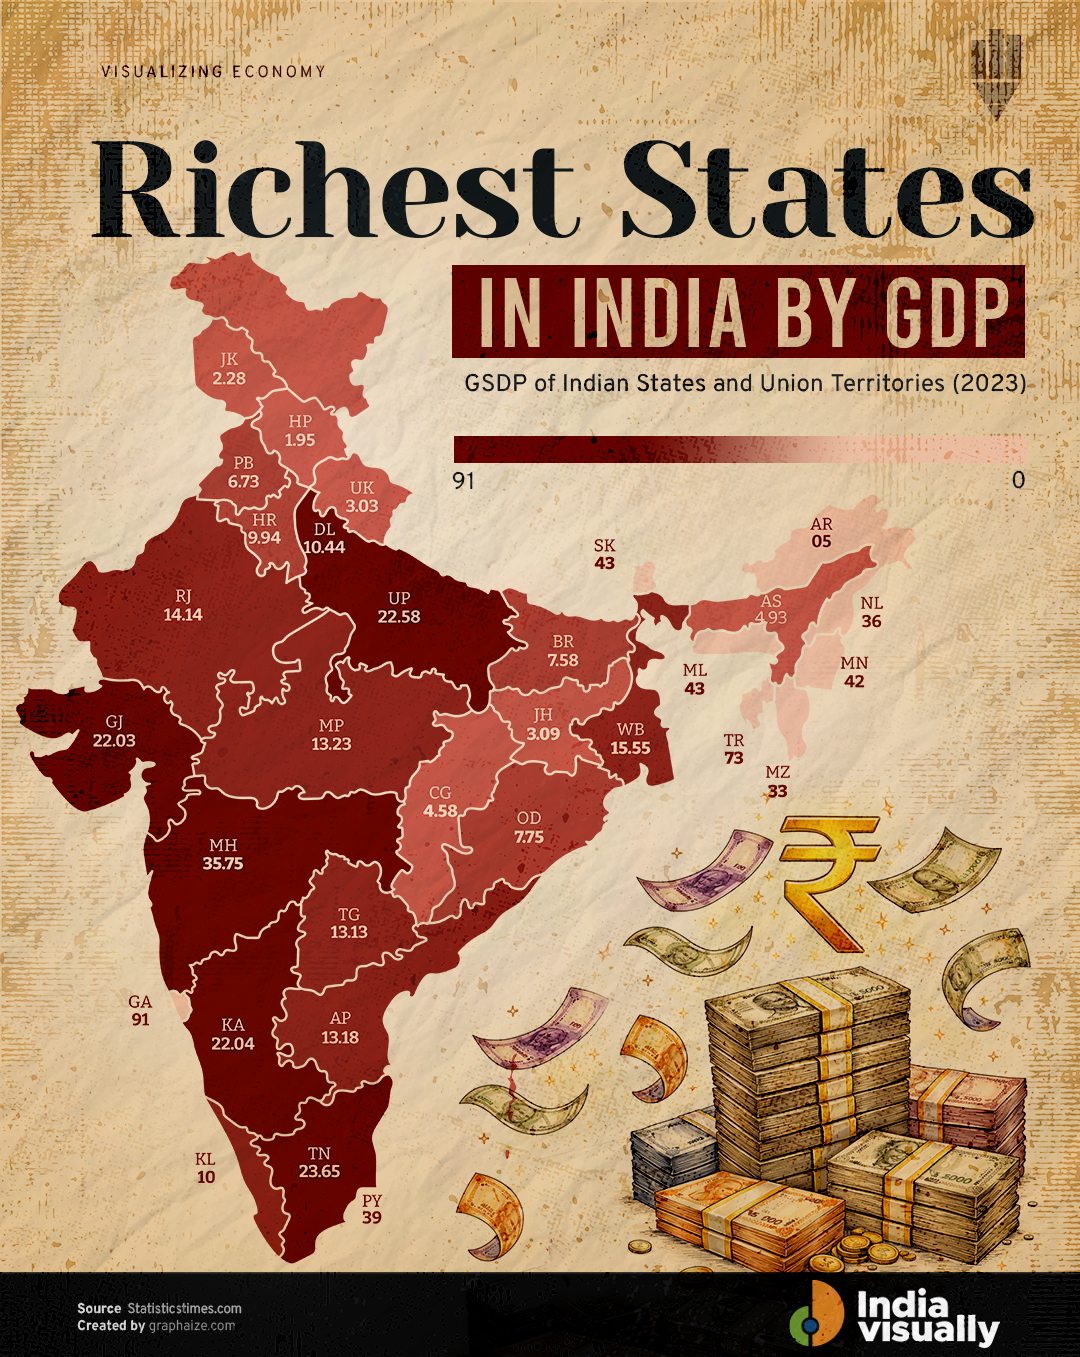
A clear pattern emerges when we look at the map and numbers together. Economic output in India is heavily concentrated in a few large states, with Maharashtra leading by a wide margin.
| Region | State / UT | GSDP Value | Key Economic Characteristics |
|---|---|---|---|
| West India | Maharashtra | 35.75 | Finance, manufacturing, services, ports, major urban centers |
| South India | Tamil Nadu | 23.65 | Automobile manufacturing, electronics, exports, industrial base |
| North India | Uttar Pradesh | 22.58 | Large population, expanding infrastructure, diversified economy |
| South India | Karnataka | 22.04 | IT services, startups, technology-led growth |
| West India | Gujarat | 22.03 | Manufacturing hubs, ports, trade, business-friendly policies |
| East India | West Bengal | 15.55 | Trade, services, urban commercial activity |
| South India | Telangana | 13.13 | IT services, pharmaceuticals, urban expansion |
| Central India | Madhya Pradesh | 13.23 | Agriculture, manufacturing, logistics |
| Central India | Chhattisgarh | 4.58 | Mining, power, moderate industrial activity |
| Urban Economy | Delhi (NCT) | 10.44 | Services, administration, consumption-driven economy |
What Drives Differences in State-wise GSDP of India
The wide gap between high- and low-GSDP states is not accidental. Industrialization plays a major role. States with strong manufacturing bases, industrial corridors, and export infrastructure naturally generate higher output.
Infrastructure and urban density are equally important. Better roads, power supply, ports, and digital connectivity reduce business costs and improve productivity. This is why coastal states often show stronger GSDP numbers.
Policy stability and governance also matter. States that create business-friendly environments attract private investment, startups, and large enterprises, which directly boosts economic output.
The map also reveals a significant regional imbalance. While no single region dominates completely, economic power is clearly tilted toward western and southern India. This imbalance highlights where future development efforts could be focused.
Final Thoughts
Looking at the richest states in India by GDP based on state-wise GSDP of India gives a grounded view of how India’s economy actually functions. From Maharashtra’s 35.75 at the top to Mizoram’s 0.33 at the lower end, the differences tell a powerful story of industrial strength, urbanization, and regional advantage.
As India continues to grow, tracking state-wise GSDP of India will remain essential for understanding opportunity, identifying imbalance, and shaping smarter economic strategies for the future.
Unlock the power of captivating visuals with our seasoned expertise! With 7 years of crafting compelling visual content, we’re ready to elevate your brand’s story. From stunning graphics to mesmerizing animations, we bring your vision to life. Let’s create engaging visuals that resonate with your audience and leave a lasting impression. Partner with us today for an unforgettable visual journey!