
Highest Grossing Movies Worldwide in 2025: Records, Rankings
India’s Tea Consumption Across States. Explore the fascinating world of tea consumption in India through our data-driven analysis. Discover state-wise trends, variations, and surprising insights. Sip into the details and brew up your knowledge on India’s favorite beverage!
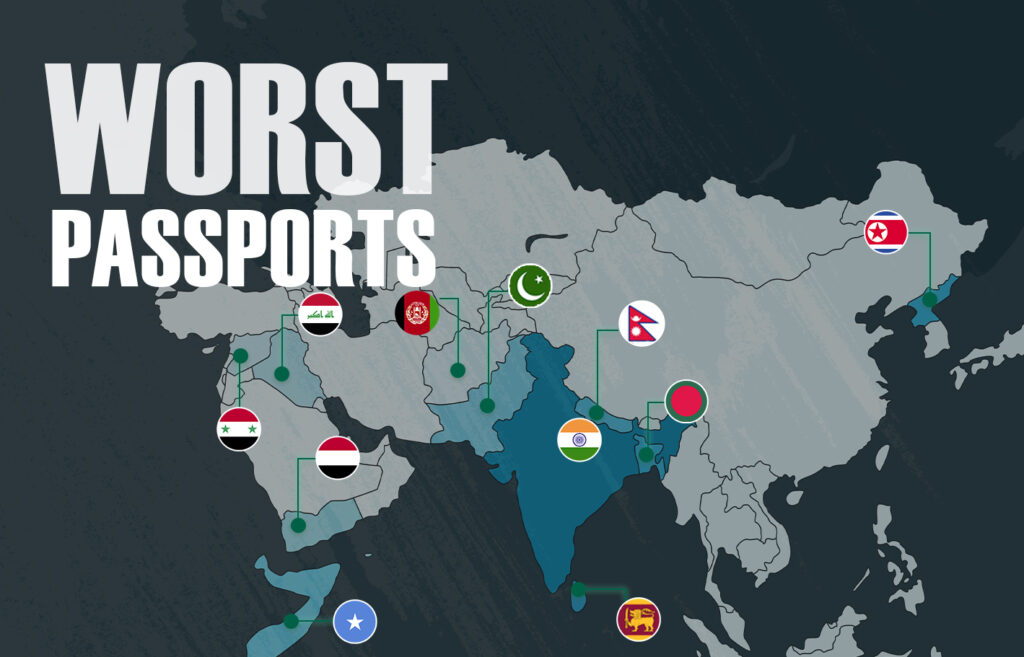
Weakest Passports in the World: Ranking Countries by Travel Restrictions
India’s Tea Consumption Across States. Explore the fascinating world of tea consumption in India through our data-driven analysis. Discover state-wise trends, variations, and surprising insights. Sip into the details and brew up your knowledge on India’s favorite beverage!
Startup Valuation in India: A Comparative Study of Startups in India’s Top Three Cities
India’s Tea Consumption Across States. Explore the fascinating world of tea consumption in India through our data-driven analysis. Discover state-wise trends, variations, and surprising insights. Sip into the details and brew up your knowledge on India’s favorite beverage!
Richest States in India by GDP Based on State-wise GSDP of India
India’s Tea Consumption Across States. Explore the fascinating world of tea consumption in India through our data-driven analysis. Discover state-wise trends, variations, and surprising insights. Sip into the details and brew up your knowledge on India’s favorite beverage!
14 Easy Ways to Get More Infographic Backlinks for Your Service Company

Discover 14 effective ways to get infographic backlinks for your service company. Boost SEO, drive traffic, and improve rankings with these smart strategies!
Extreme Weather in India: Visualizing Life Loss Statistics
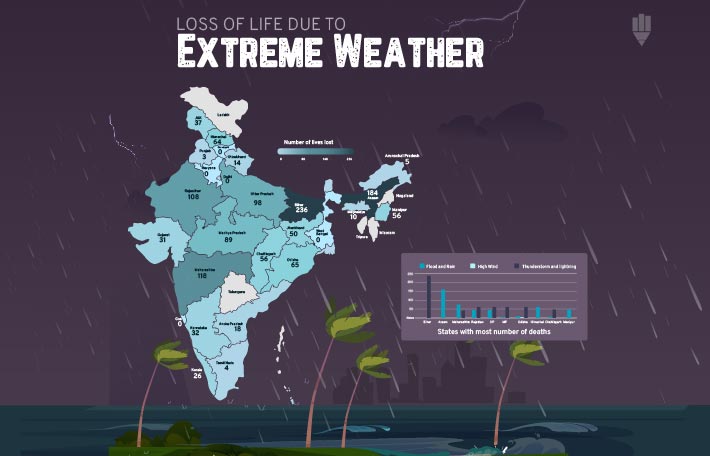
Discover the staggering impact of extreme weather on human life through compelling data visuals. Learn more about the statistics and how we can mitigate these losses. Explore now!
BJP vs Congress Manifesto 2024: A Visual Comparison
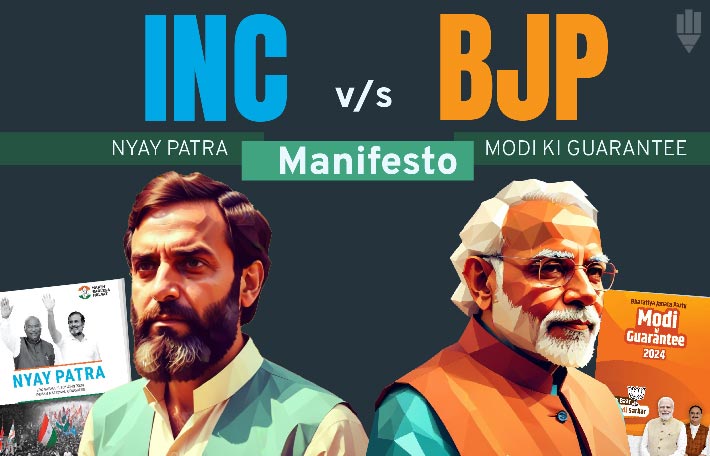
Discover a detailed comparison of BJP vs Congress manifesto 2024 promises with engaging data visuals. Dive into the statistics and see what each party plans for the future. Explore now to visualize who promised better.
10 Years of Press Freedom: Visual Insights
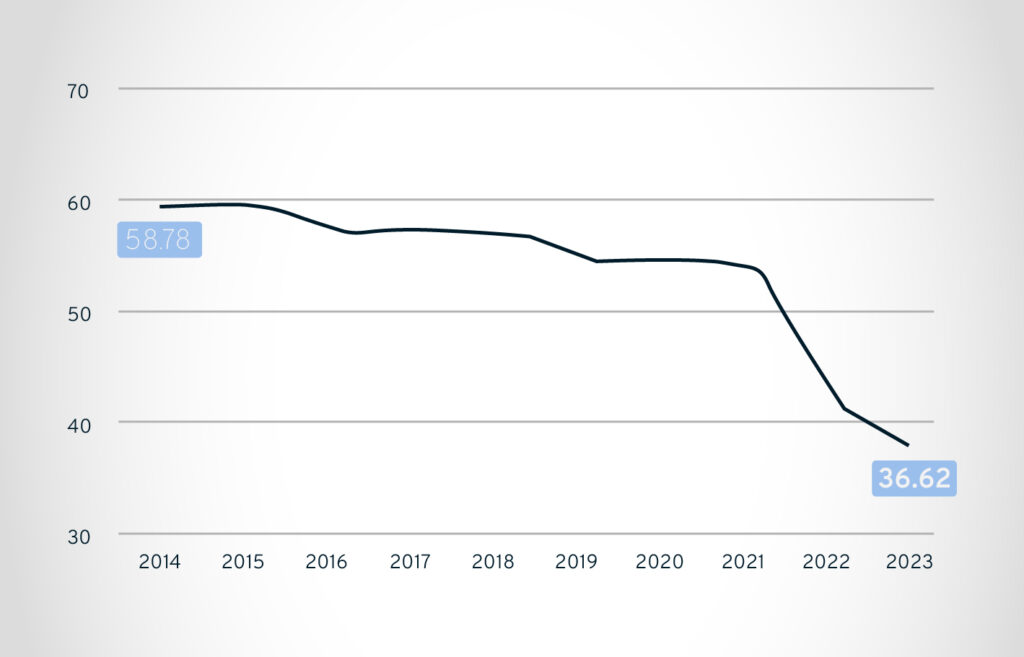
Explore our detailed analysis of 10 years of Press Freedom through engaging data visuals. Discover the trends, challenges, and improvements in global press freedom. Let’s dive into the data and learn more!