
Visualising the Rise and Fall of Byju’s
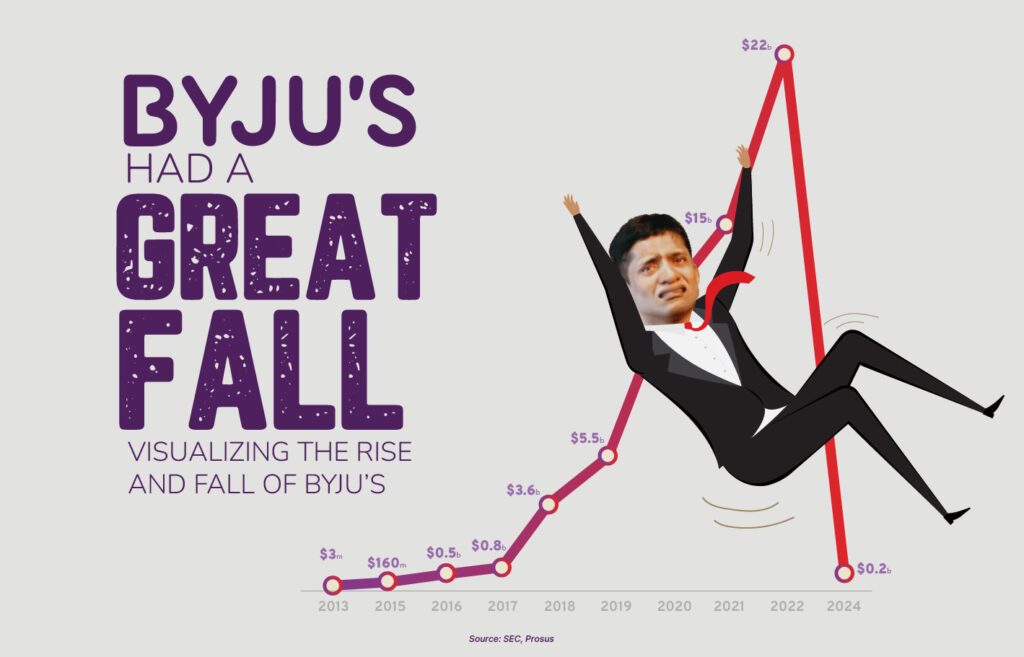
Explore Byju’s rise and fall through visuals, uncovering key moments, growth drivers, and challenges that shaped this EdTech giant’s journey. See the full story in data!
Most Expensive Shares in India 2024: Insights
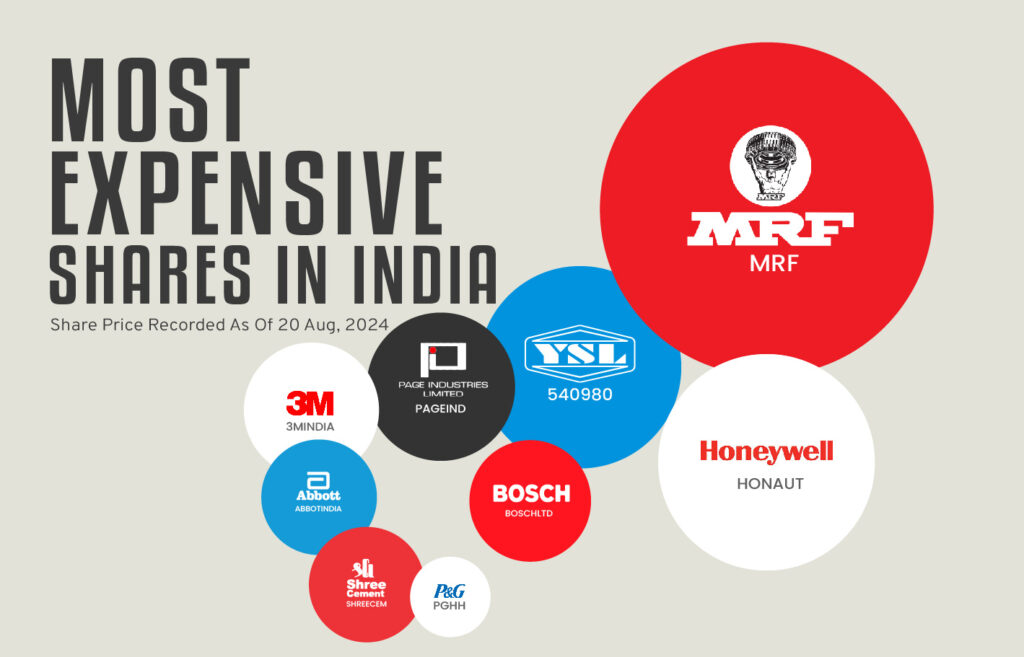
Discover the most Expensive Stocks in India for 2024! See which shares hold the highest value and what makes them stand out in the market.
Decoding 20 Years of Sensex Budget Day Performance

Discover how the Sensex Budget Day Performance over the last 20 years. Uncover trends, insights, and surprises in this detailed analysis!
Extreme Weather in India: Visualizing Life Loss Statistics
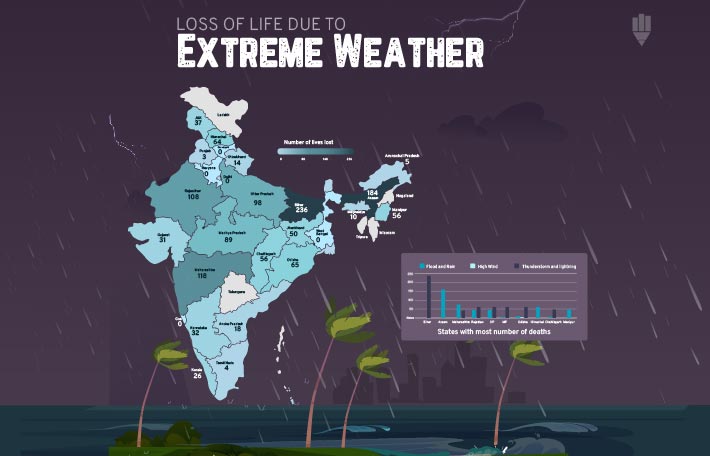
Discover the staggering impact of extreme weather on human life through compelling data visuals. Learn more about the statistics and how we can mitigate these losses. Explore now!
Manmohan vs Modi: A Decade of Economic Impact
Explore the economic legacy of Manmohan Singh and Narendra Modi through data visuals. Compare their policies and outcomes to understand India’s economy over the past decade. Dive in to see who made the biggest impact!
BJP vs Congress Manifesto 2024: A Visual Comparison
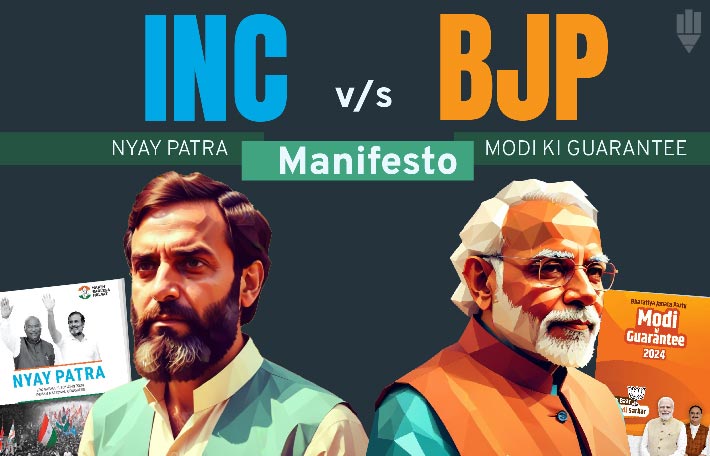
Discover a detailed comparison of BJP vs Congress manifesto 2024 promises with engaging data visuals. Dive into the statistics and see what each party plans for the future. Explore now to visualize who promised better.
The Impact of AI on Jobs: A Visual Breakdown
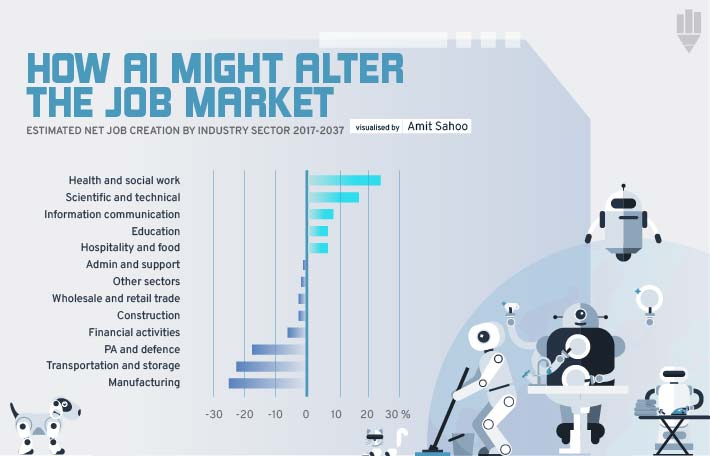
Explore the impact of AI on jobs with our comprehensive visual breakdown. Discover key statistics and insights on how AI is transforming the job market. Check the infographic to get into the data and understand the future of work!