
If you’ve ever followed Indian investing conversations, you’ve probably heard this debate more times than you can count: gold or the stock market what really creates wealth? For decades, Indian households have trusted gold as a symbol of safety, while equities, represented by the Sensex, have promised growth and prosperity. But when we zoom out and look at the last two decades, the story becomes far more interesting and data backed.
This article breaks down the gold vs sensex returns debate using a 20 year lens, cutting through emotion and focusing on numbers, market cycles, and investor behavior. But to truly understand which investment performed better, we need a way to measure long term returns properly and that’s where CAGR comes in. By the end, you’ll have a clear answer to who “won” the long race and why the smarter strategy might not be choosing just one.
What is CAGR and Why It Matters ?
CAGR (Compound Annual Growth Rate) shows how fast an investment grows annually over time, factoring in compounding.
In simple terms, it tells you the real yearly growth rate of your money, even if returns fluctuate every year.
This makes CAGR one of the most important metrics when comparing gold vs sensex returns, because it gives a clear picture of long-term performance.
A 20 Year Comparison
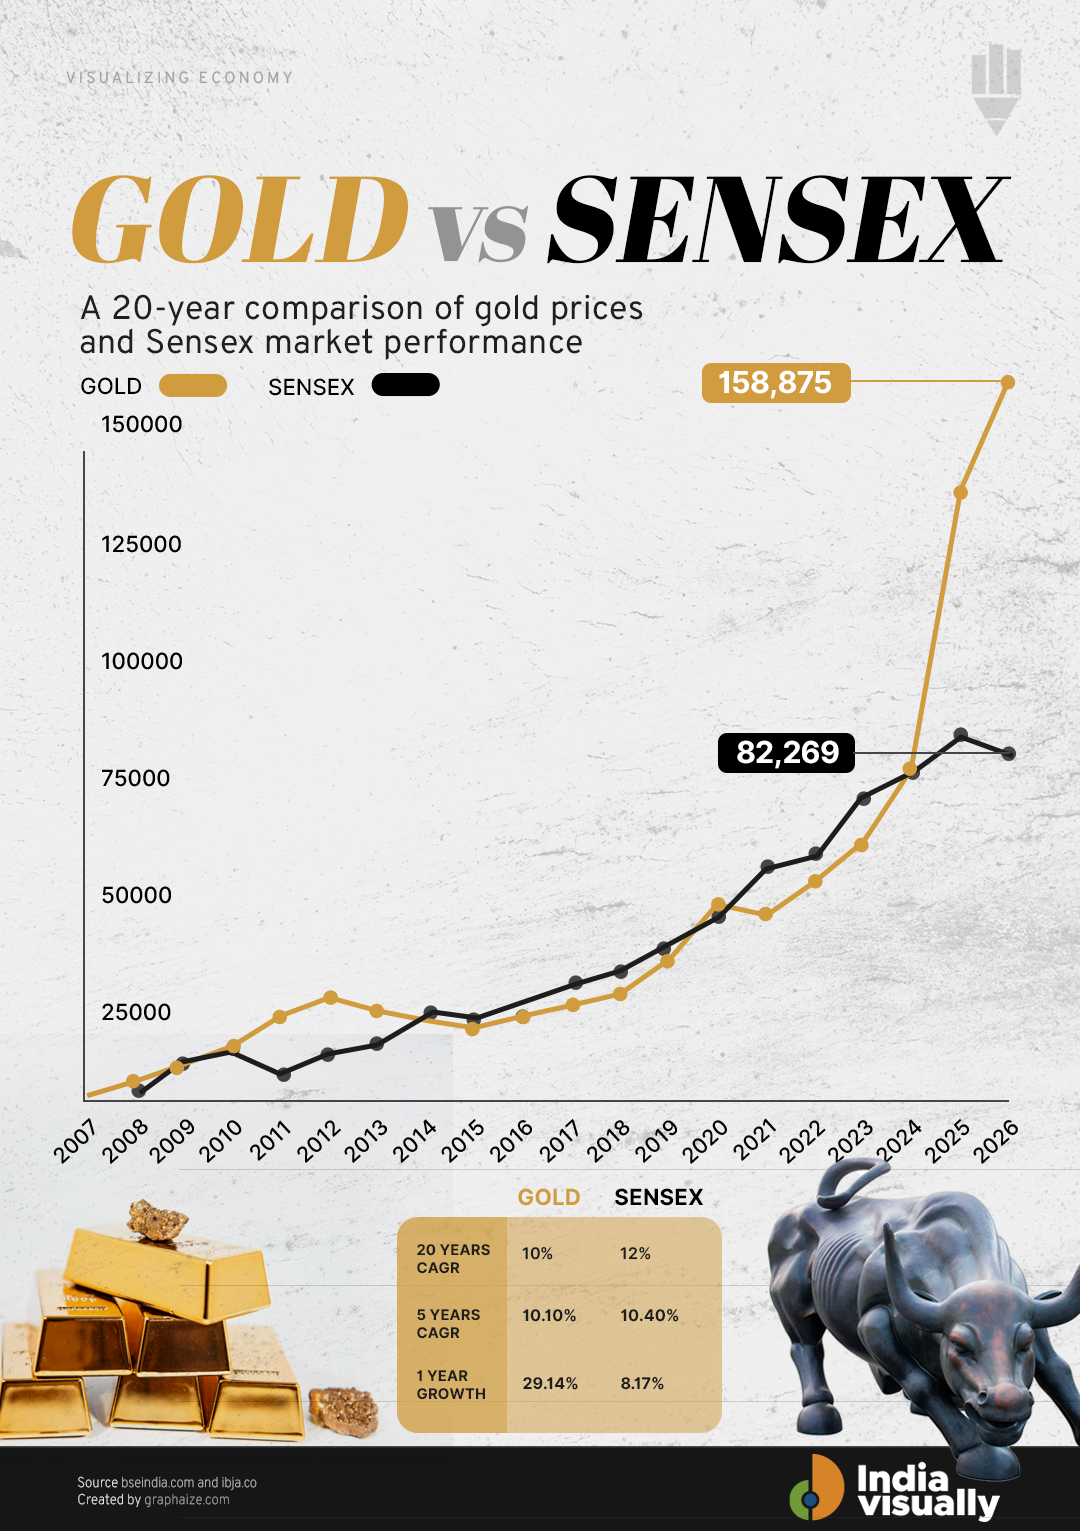
Let’s start with the numbers, because long-term investing is all about compounding.
Between 2007 and 2026, gold prices in India climbed from around ₹10,598 per 10 grams to approximately ₹1,58,875. That’s not just a price rise it translates into a compound annual growth rate (CAGR) of roughly 15.3% over 20 years. That’s powerful compounding by any standard.
Now compare that with the Sensex. Over the same period, the benchmark index moved from about 20,286 points in 2007 to nearly 82,269 points by 2026, delivering around 7.6%. Respectable? Absolutely. But clearly lower than gold’s long term compounded return.
This contrast sits at the heart of the gold vs sensex returns comparison. Gold quietly compounded at a faster pace, while the Sensex delivered growth in bursts strong during economic booms and painful during downturns.
What explains this gap? The answer lies in when and why each asset performs.
Gold Price Trend in India (Year wise)
| Year | Gold Price (₹/10g) | Annual % Change |
|---|---|---|
| 2007 | 10,598 | — |
| 2008 | 13,630 | 28.61% |
| 2009 | 16,686 | 22.42% |
| 2010 | 20,728 | 24.22% |
| 2011 | 27,329 | 31.85% |
| 2012 | 30,859 | 12.92% |
| 2013 | 28,422 | -7.90% |
| 2014 | 26,703 | -6.05% |
| 2015 | 24,931 | -6.64% |
| 2016 | 27,445 | 10.08% |
| 2017 | 29,156 | 6.23% |
| 2018 | 31,391 | 7.67% |
| 2019 | 39,108 | 24.58% |
| 2020 | 50,511 | 29.16% |
| 2021 | 48,099 | -4.78% |
| 2022 | 55,017 | 14.38% |
| 2023 | 63,203 | 14.88% |
| 2024 | 78,245 | 23.80% |
| 2025 | 1,36,570 | 74.54% |
| 2026 | 1,58,875 | 16.33% |
Why Gold Shined During Crises and Uncertain Years
Gold’s strongest years weren’t random. They coincided almost perfectly with global and domestic stress.
During the 2008 to 2011 global financial crisis, gold posted gains of over 30% in multiple years, while equities struggled to stay afloat. In 2008 alone, gold rose by roughly 29%, even as the Sensex collapsed by more than 50%. Investors weren’t chasing returns they were chasing safety.
Fast forward to 2020, and history repeated itself. As COVID 19 froze economies and markets crashed, gold jumped by around 29%. The Sensex initially fell sharply before recovering later, thanks to massive liquidity support from central banks. Gold, however, moved up almost immediately, reflecting its role as a crisis hedge.
Another standout year was 2025, when gold surged by nearly 74%. This spike was driven by a combination of high inflation fears, geopolitical tensions, and currency weakness. Once again, uncertainty pushed investors toward the yellow metal.
The pattern is clear. Gold thrives when confidence breaks down. Inflation, wars, pandemics, and policy uncertainty all boost demand for gold because it’s seen as a store of value. That’s why, over a long horizon, gold’s compounding looks smoother and more consistent even if it doesn’t always outperform in boom years.
Sensex Growth Cycles: Where Equities Take the Lead
While gold dominates during chaos, the Sensex tells a very different story during stable and optimistic periods.
Take 2009, for example. After the brutal crash of 2008, the Sensex rebounded by an astonishing 81%, one of its strongest annual performances ever. Gold did well too but equities clearly led the recovery once confidence returned.
A similar trend played out during 2014 to 2017, when reform optimism, improved governance, and earnings recovery fueled a strong bull market. The Sensex benefited from rising corporate profits and renewed foreign investor interest, while gold entered a relatively subdued phase.
Then came 2021, a year defined by low interest rates and abundant liquidity. As economies reopened post COVID 19, the Sensex gained about 22%, riding the wave of easy money and strong retail participation. Gold, by contrast, delivered more modest returns during this growth-focused phase.
This highlights a key truth: the Sensex is tightly linked to economic growth, earnings expansion, and investor confidence. When businesses grow and profits rise, equities shine. But when growth falters or uncertainty spikes, the same volatility that drives high returns can quickly turn into steep losses.
Sensex Performance (Year wise)
| Year | Sensex Value | Annual % Change |
|---|---|---|
| 2007 | 20,286 | — |
| 2008 | 9,647 | -52.45% |
| 2009 | 17,465 | 81.03% |
| 2010 | 20,509 | 17.43% |
| 2011 | 15,455 | -24.64% |
| 2012 | 19,427 | 25.70% |
| 2013 | 21,171 | 8.98% |
| 2014 | 27,499 | 29.89% |
| 2015 | 26,118 | -5.03% |
| 2016 | 26,626 | 1.95% |
| 2017 | 34,057 | 27.91% |
| 2018 | 36,068 | 5.91% |
| 2019 | 41,254 | 14.38% |
| 2020 | 47,751 | 15.75% |
| 2021 | 58,254 | 21.99% |
| 2022 | 60,841 | 4.44% |
| 2023 | 72,240 | 18.74% |
| 2024 | 78,139 | 8.17% |
| 2025 | 85,221 | 9.06% |
| 2026 | 82,270 | -3.46% |
The Sensex tells a story of sharp falls followed by powerful recoveries rewarding patience, but punishing panic.
Volatility, Inflation, and Investor Behavior: The Real Difference
One of the biggest differences between gold and the Sensex lies in how they handle volatility.
Over the past 20 years, gold’s negative phases were relatively mild. Even during weak stretches like 2013 to 2015, annual declines were mostly limited to the −6% to −8% range. These were corrections, not crashes.
The Sensex, on the other hand, experienced deep drawdowns 2008 and early 2020 being prime examples. While these crashes were followed by sharp recoveries, they required patience, discipline, and time.
Inflation and currency movements also play a crucial role. Gold tends to perform well when inflation rises, the rupee weakens, or global uncertainty increases. The Sensex performs better when economic growth is strong, corporate earnings expand, and investor confidence remains high.
This difference reflects investor behavior as well. Gold attracts investors during uncertainty, while equities reward those who stay invested through volatility.
In simple terms, gold provides stability, while the Sensex drives long term wealth creation.
Verdict: Who Really Won the 20-Year Race?
So, who owns the 20-year race?
From a pure numbers perspective:
- Gold CAGR (2007–2026): 15.3%, focused on wealth protection
- Sensex CAGR (2007–2026): 7.6%, focused on wealth creation
Gold clearly outpaced the Sensex in compounded returns over this period, largely because it thrived during repeated global and domestic crises. It delivered smoother growth, lower drawdowns, and strong protection against inflation and currency erosion.
But that doesn’t make equities irrelevant. The Sensex remains essential for capturing economic growth, corporate profitability, and long-term capital appreciation. Its sharp rallies during stable periods are difficult to match.
The real takeaway from the gold vs sensex returns comparison isn’t about choosing sides. It’s about balance. Gold protects wealth when things go wrong. The Sensex grows wealth when things go right. Over the last 20 years, investors who understood this balance and allocated accordingly were the real winners.
In investing, the race isn’t just about speed. It’s about surviving every lap.
Unlock the power of captivating visuals with our seasoned expertise! With 7 years of crafting compelling visual content, we’re ready to elevate your brand’s story. From stunning graphics to mesmerizing animations, we bring your vision to life. Let’s create engaging visuals that resonate with your audience and leave a lasting impression. Partner with us today for an unforgettable visual journey!